|
How many shots do you need to fire? How do you know if a result was just random luck? Have you given up on testing because it's too hard to make an improvement? All of these questions have answers. Last week I built a statistics calculator, but there were no instructions. This article concludes the series on statistics with an explanation of my iterative load development philosophy, and how to practically apply simple statistics to make sense of your test results.  Four random 5-shot groups from the same population
9 Comments
I have just finished creating an online stats calculator that allows you to measure one or two groups of shot data, calculate the average and SD of the underlying population with confidence levels, and compare two groups to see if they are probably different or just a result of random chance. 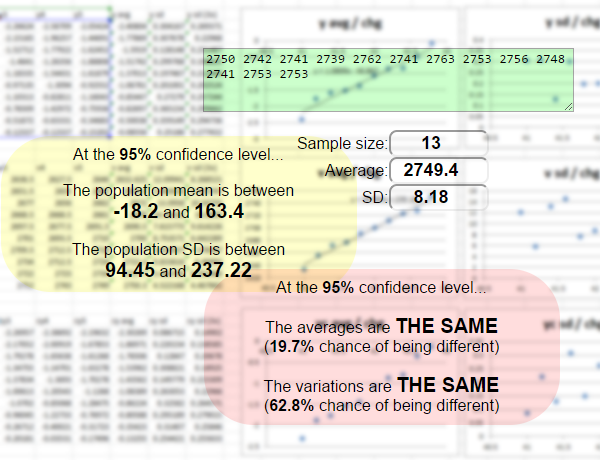 You can use this with velocities or point of impact measurements. Read the previous blog article first to understand how the population matters, and next week I will cover many example scenarios to show how these calculations can save you from wasting time and ammo in the future. I have been very busy lately, with development of the new AutoThrow trickler add-on nearing completion and also creating a video for the Two-Box Chrono. I promise... I'll write the new article next week. In the meantime, run some of your old data through the calculator, and have fun with it! A few weeks ago, I read Damon Cali's blog article demonstrating his innovative analysis method. This article contributed to my motivation to start this blog and discuss statistics applied to shooting. He fired 175 shots on paper, and visualized the 5-shot group sizes as a contour plot to determine the optimal charge and seating depth. As you can read in his article, it is an effective way to identify the smallest group and any trends. 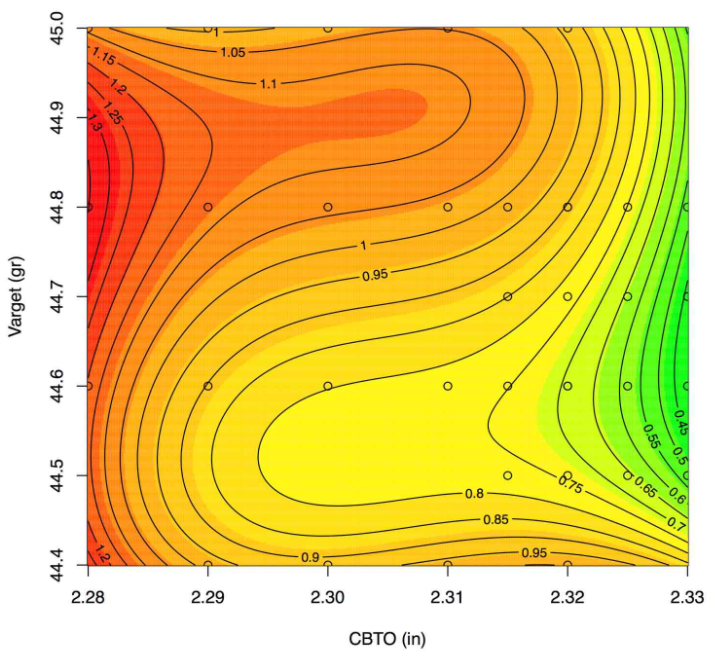 I thought it would benefit from a measure of statistical confidence. To rely on the results, you need to know you've fired enough shots. Further, I thought by analyzing each shot individually, rather than the ES of each 5-shot group, it might lead to some deeper insights.
I contacted him for the raw data and performed my own analysis, then wrote a guest blog article, which you can read over at his site, Bison Ballistics. In this article, I use many statistical tools to show how a deeper view of data can lead to unexpected discoveries and a more accurate load. This opportunity presented itself so I took a short detour from my plan to show you exactly how to apply these concepts for yourself. You can look forward to that article very soon! |
Who am I?Adam MacDonald: Canadian FTR shooter, inventor, problem solver. Archives
May 2019
|
 RSS Feed
